html Prevention programme report for Wrocław | FIMOGRAFIKA
Prevention programme report for Wrocław
Print

Report for Wrocław

Project
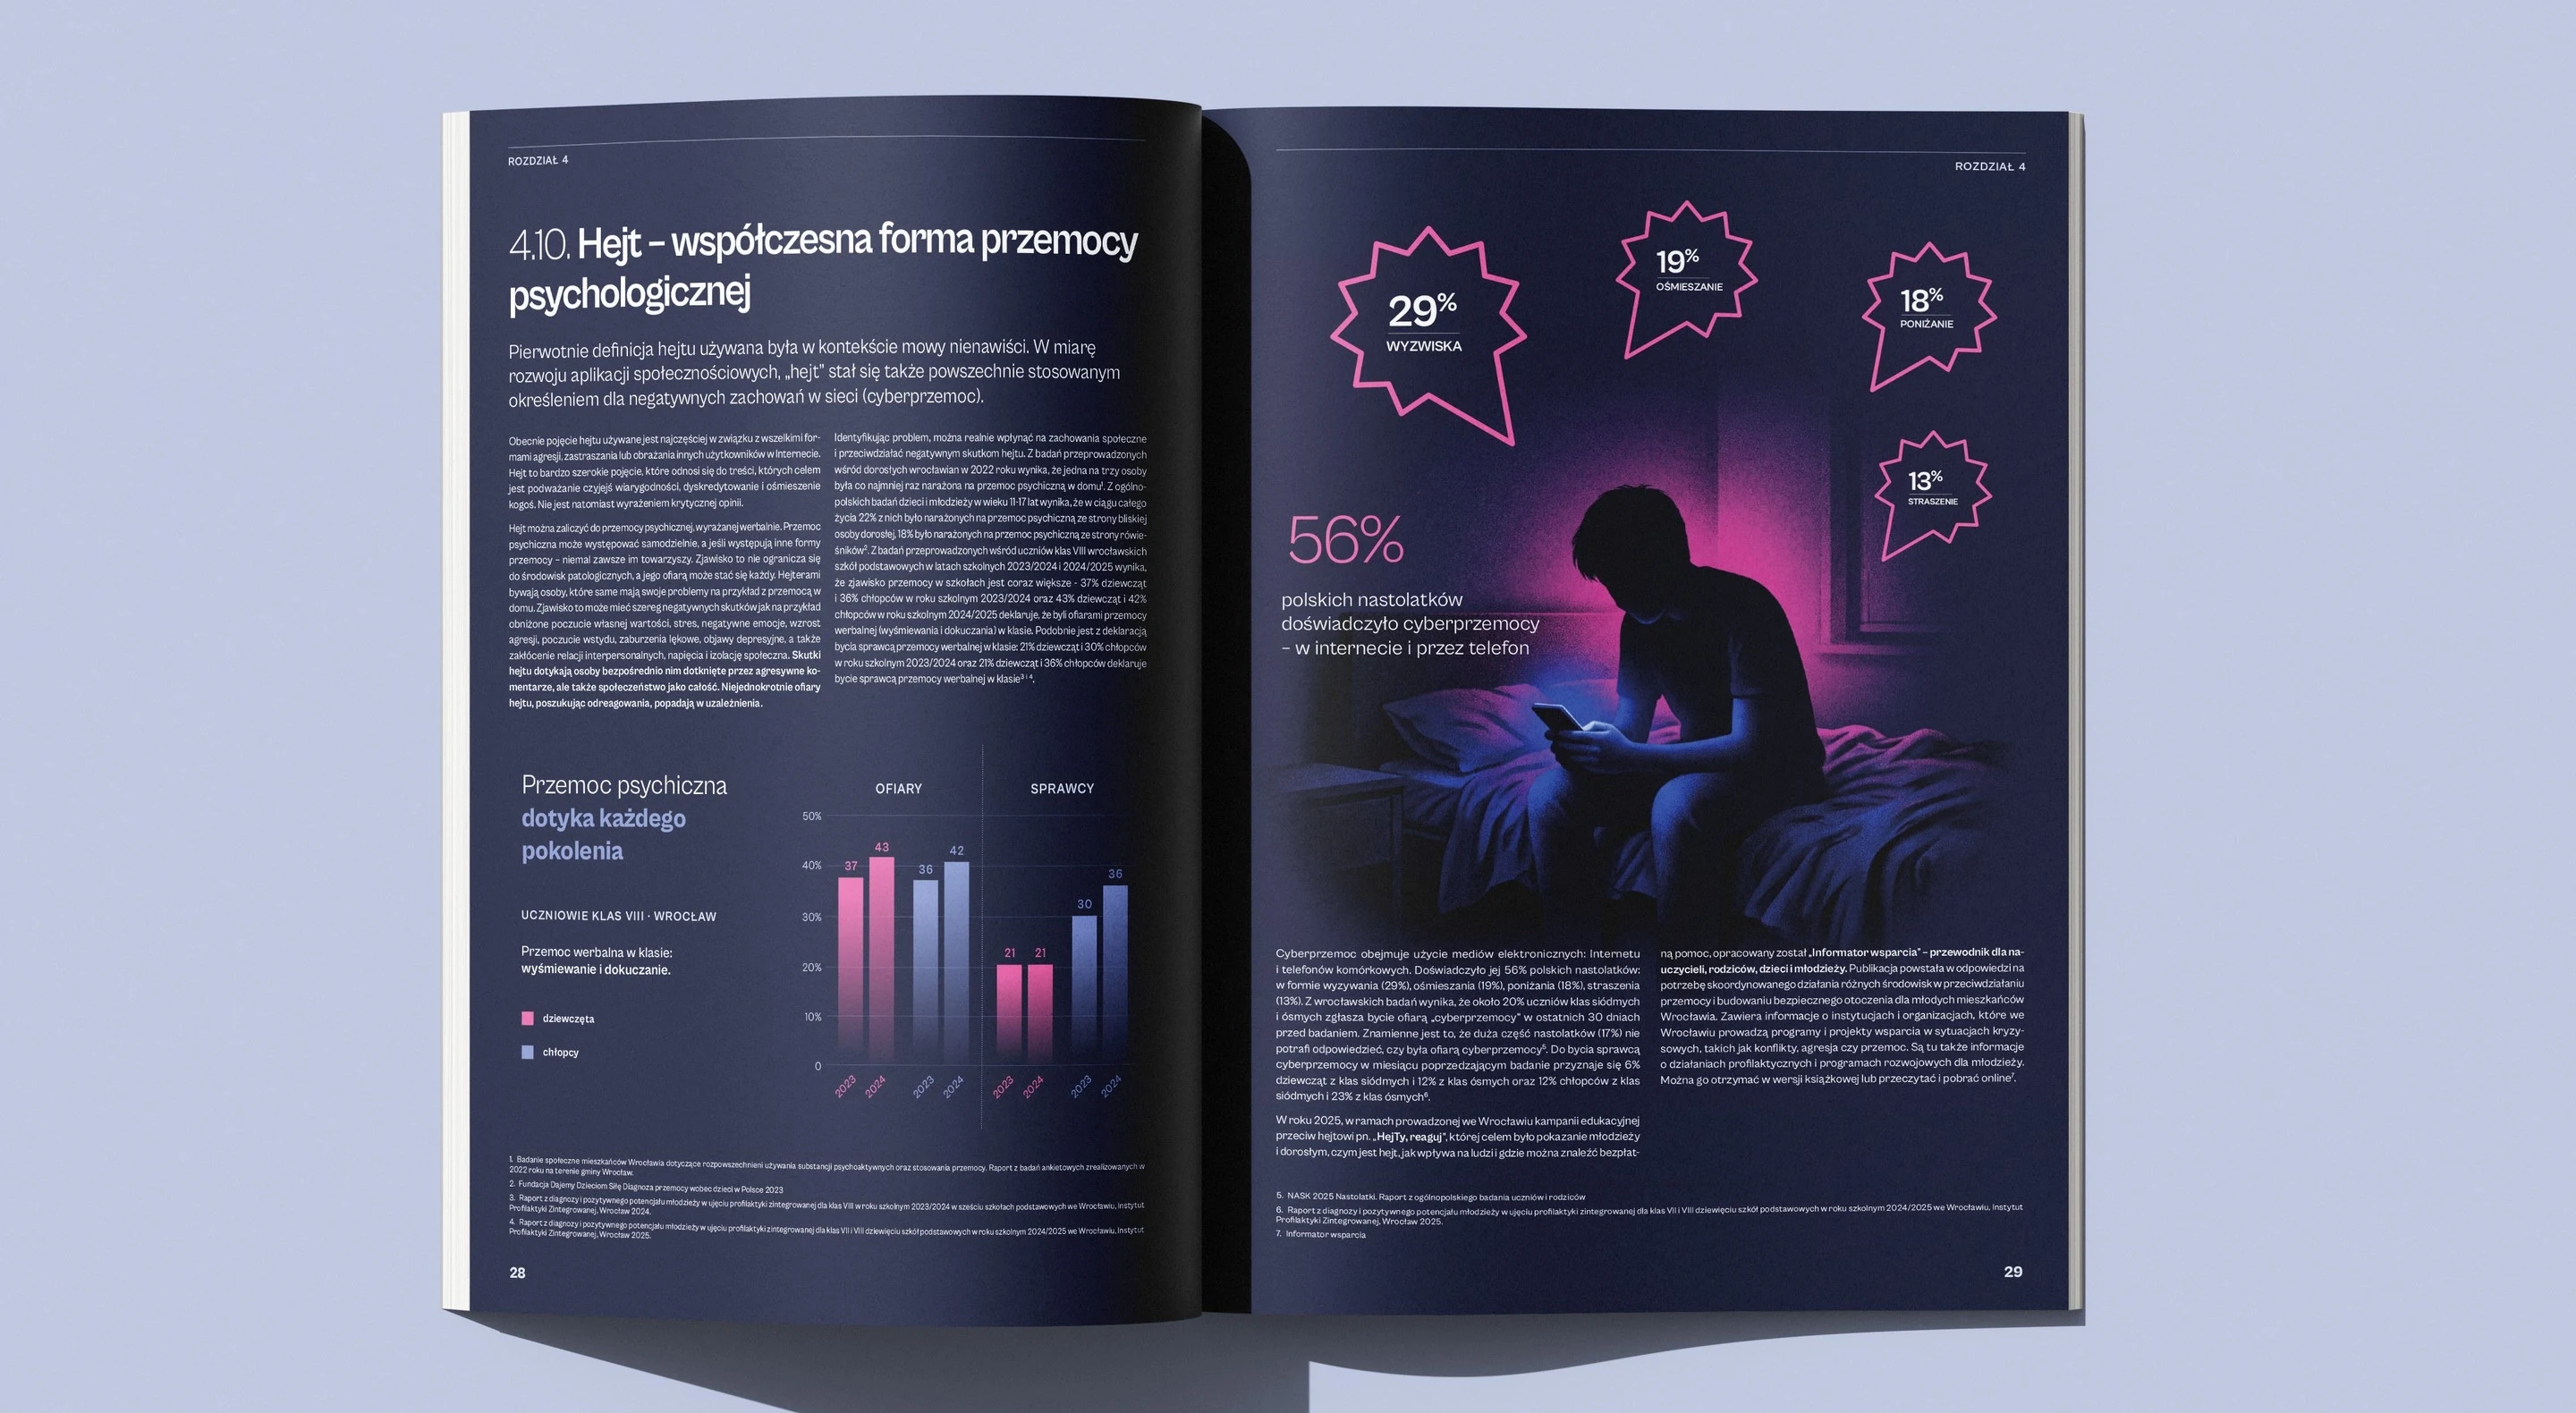
Prevention programme report for Wrocław – image 1
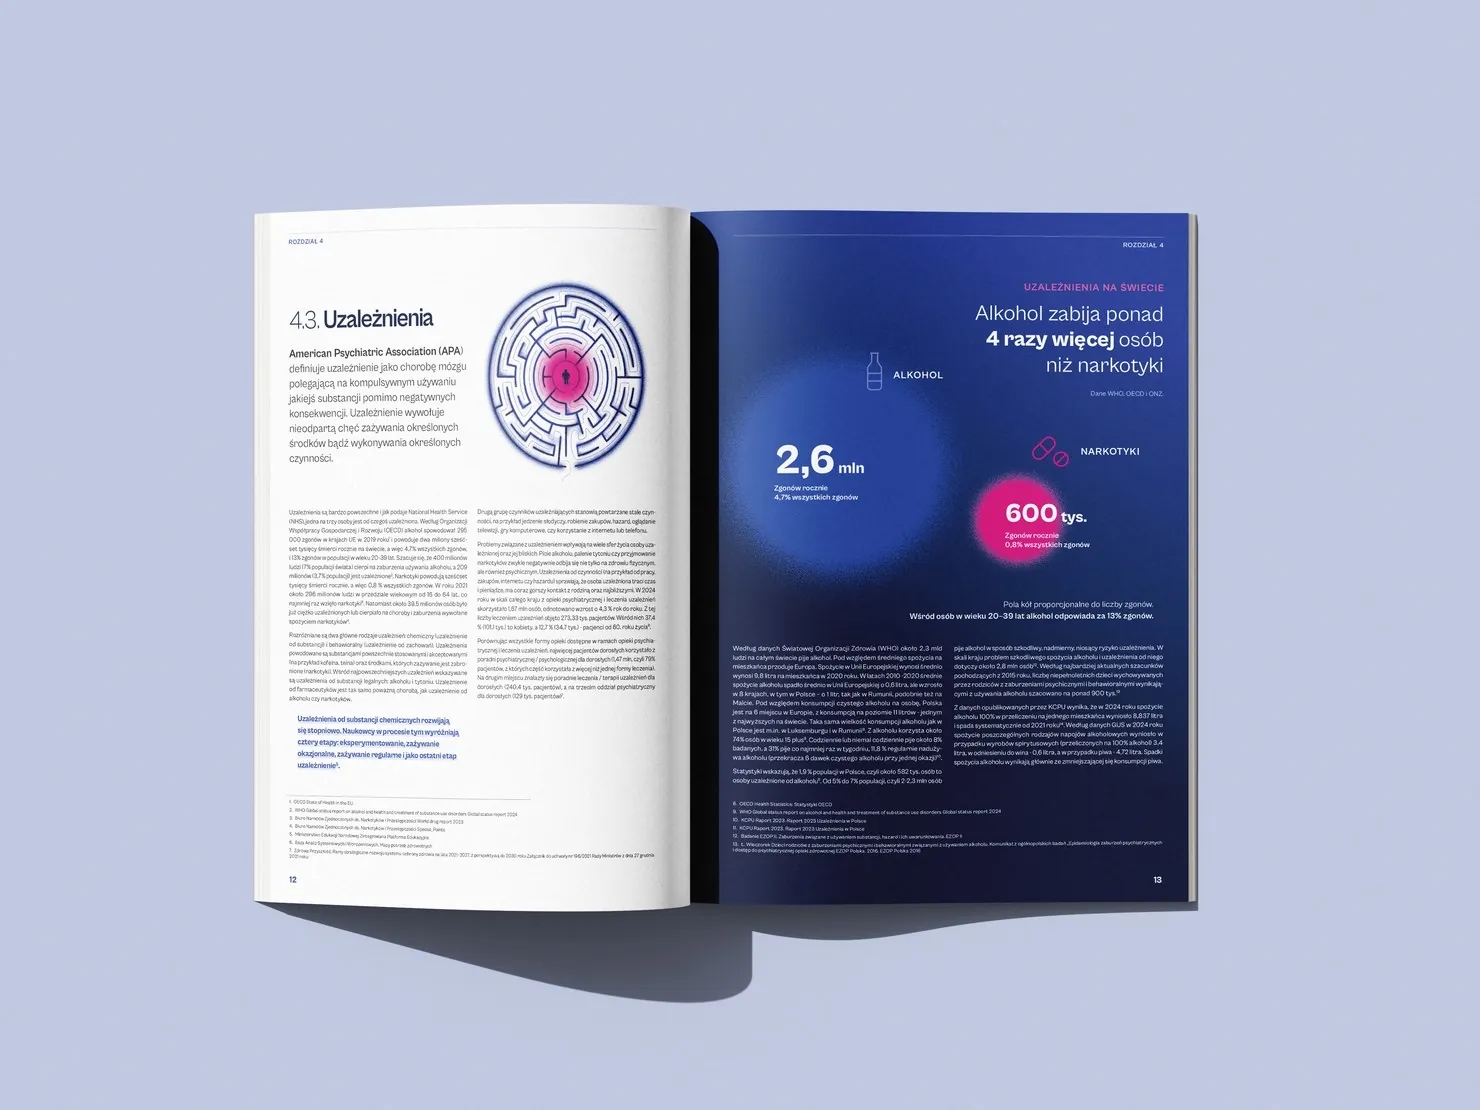
Prevention programme report for Wrocław – image 2

Raw data turned into clear infographics

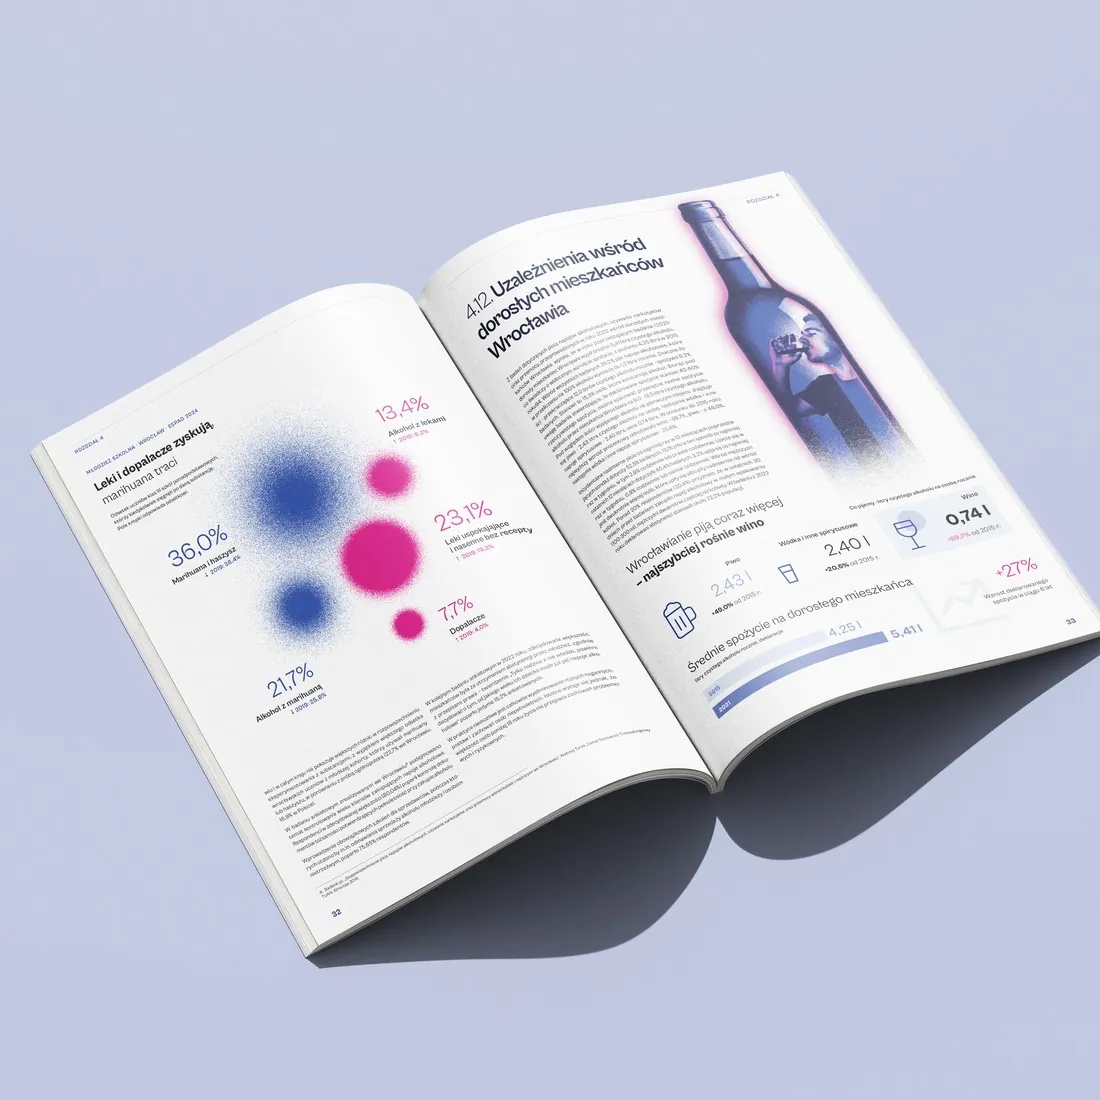
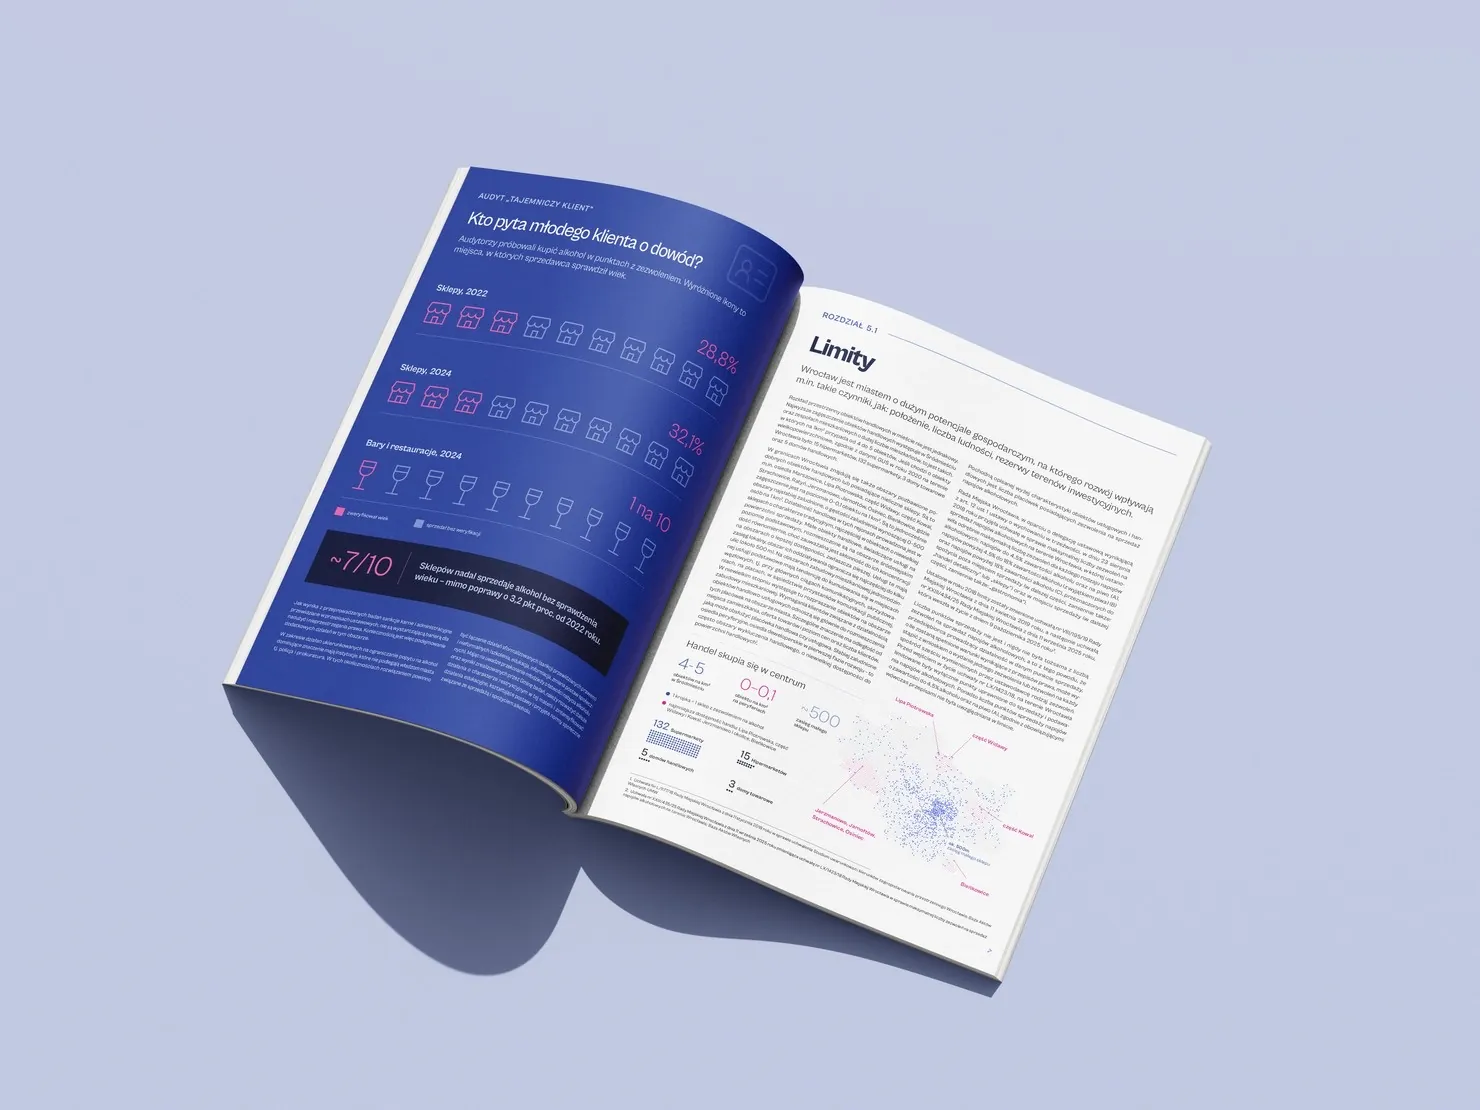
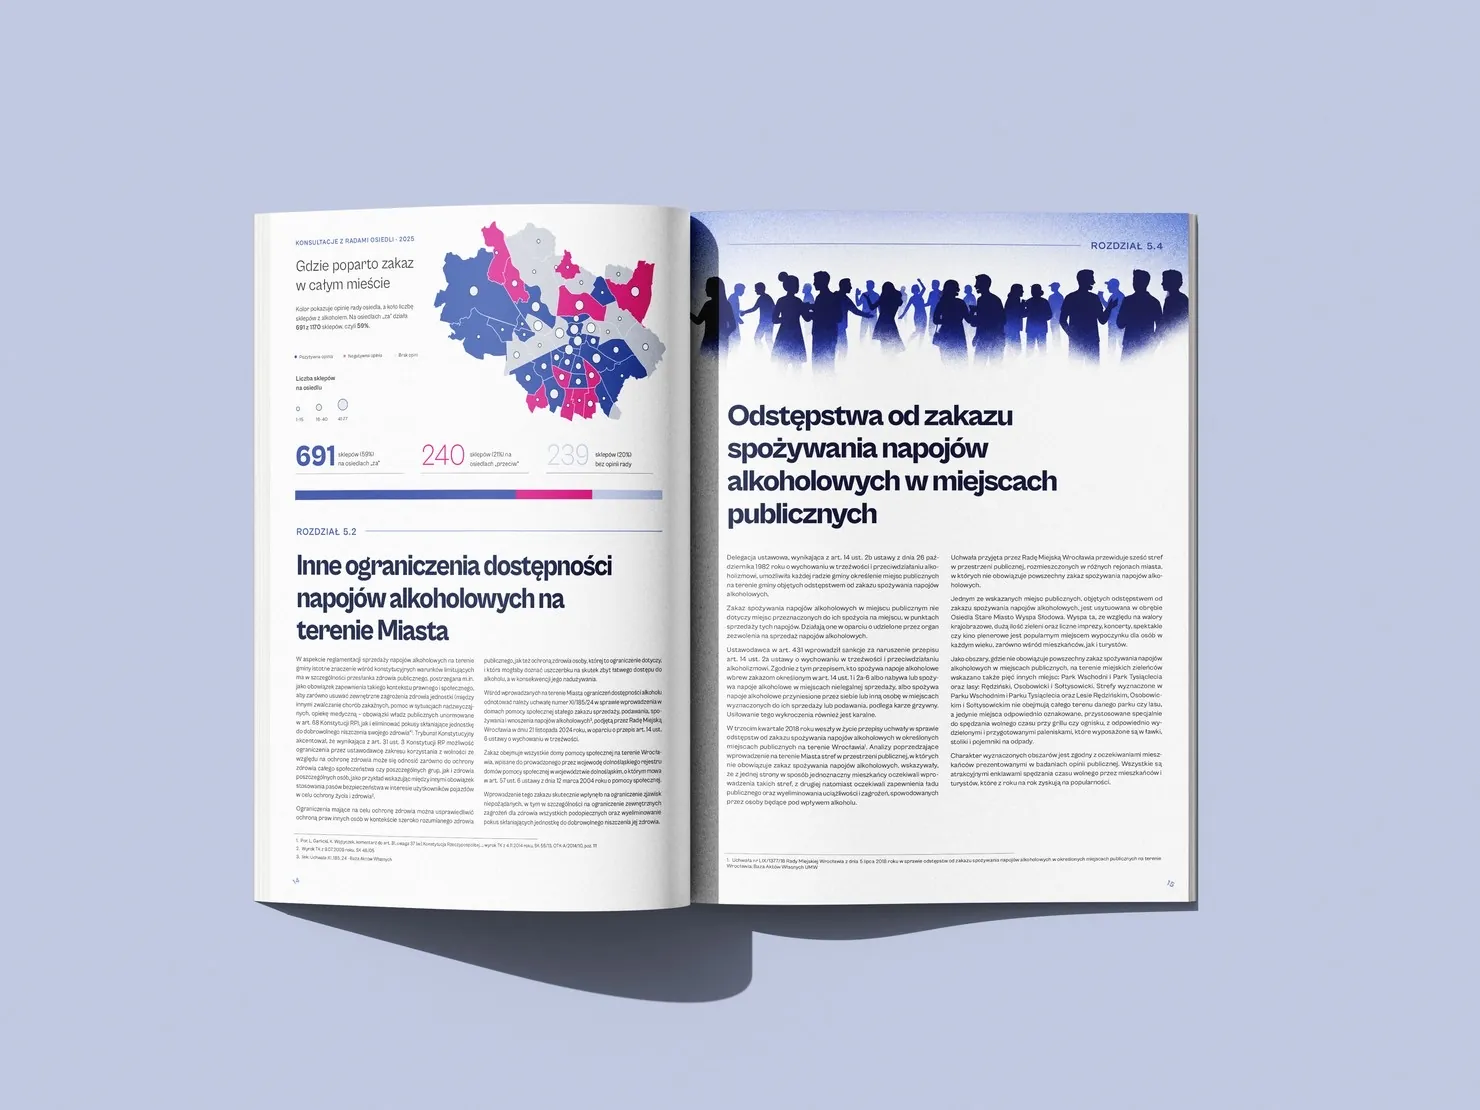
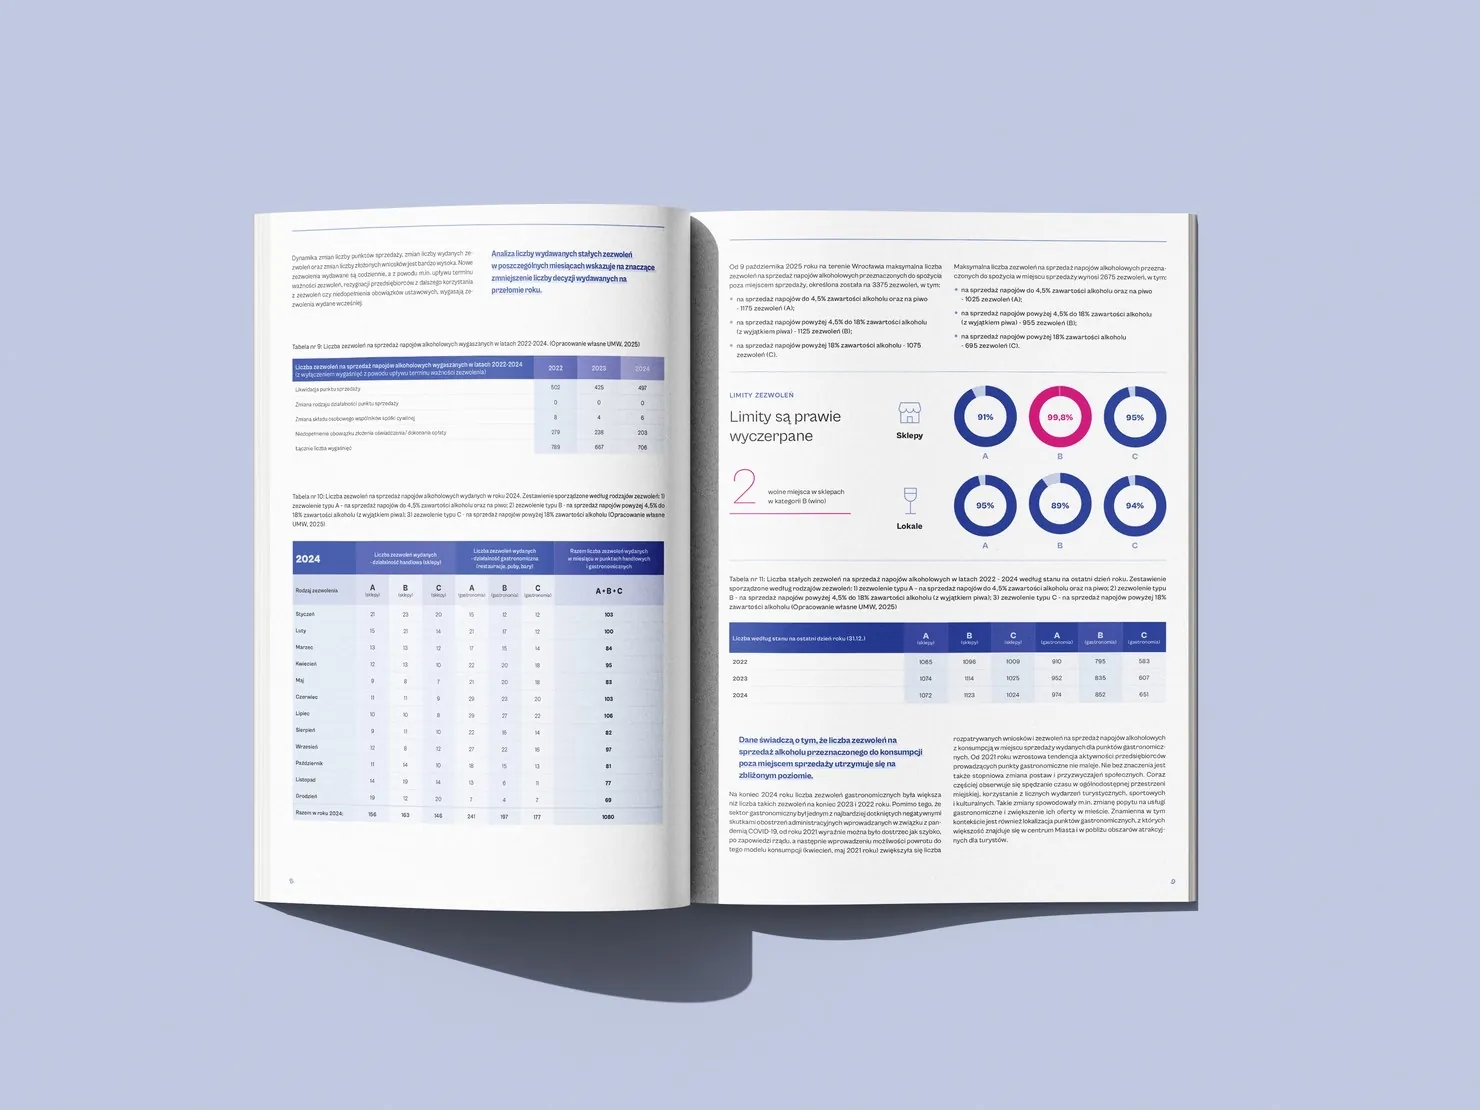
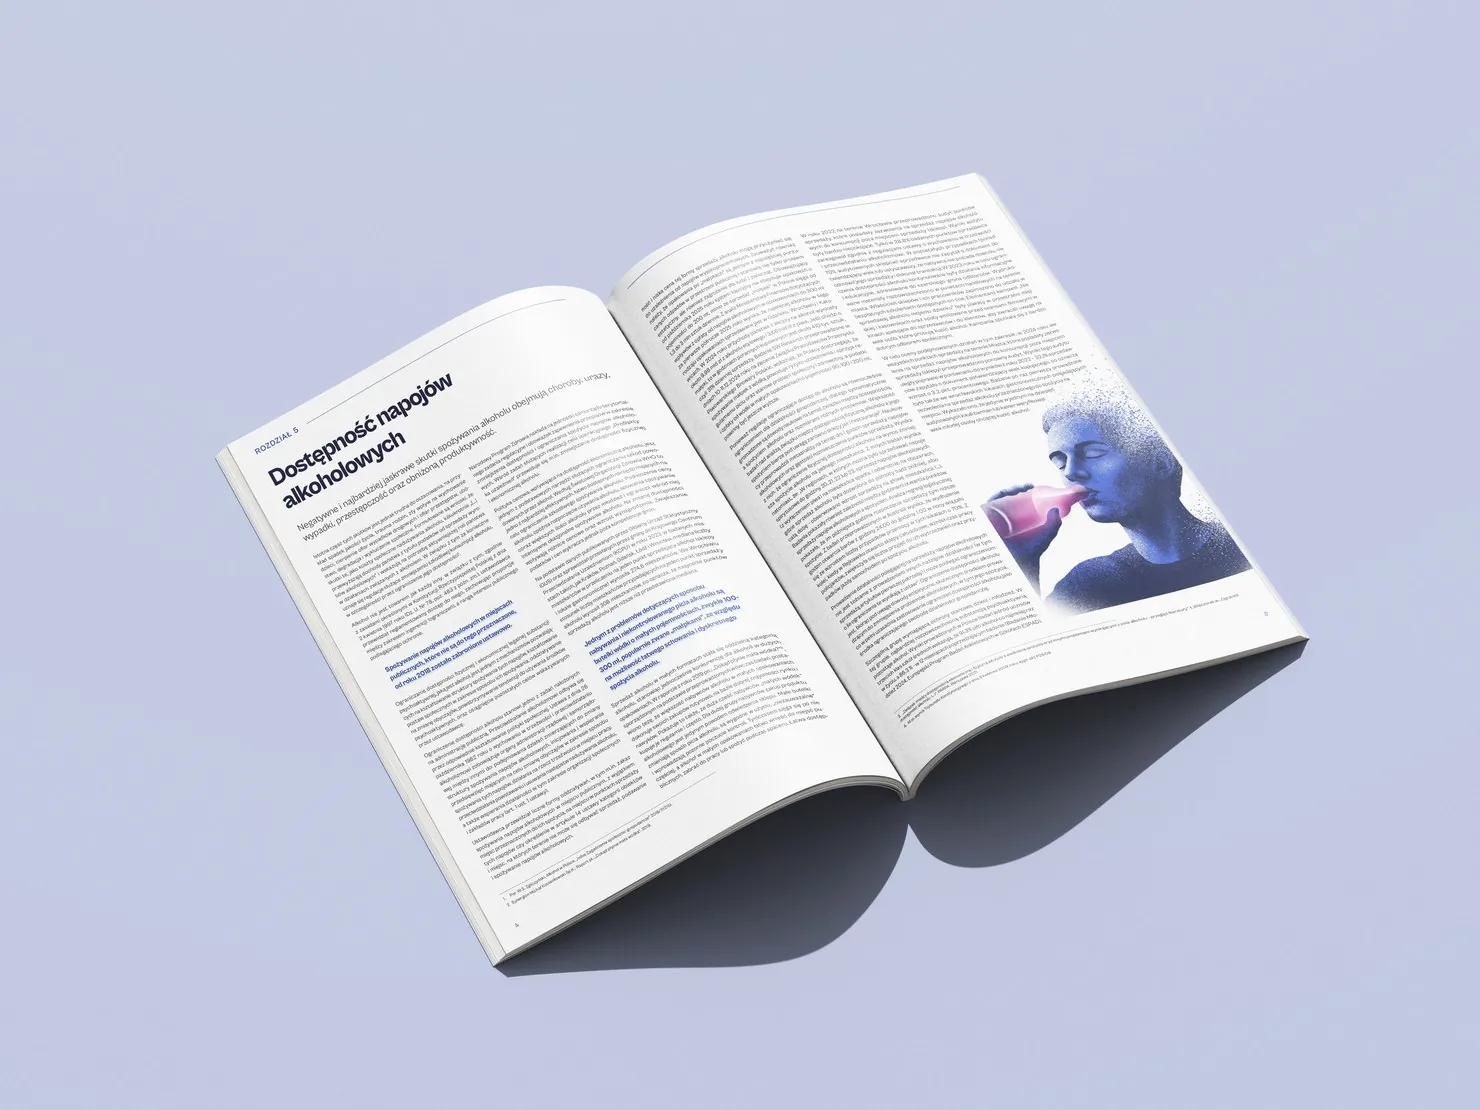
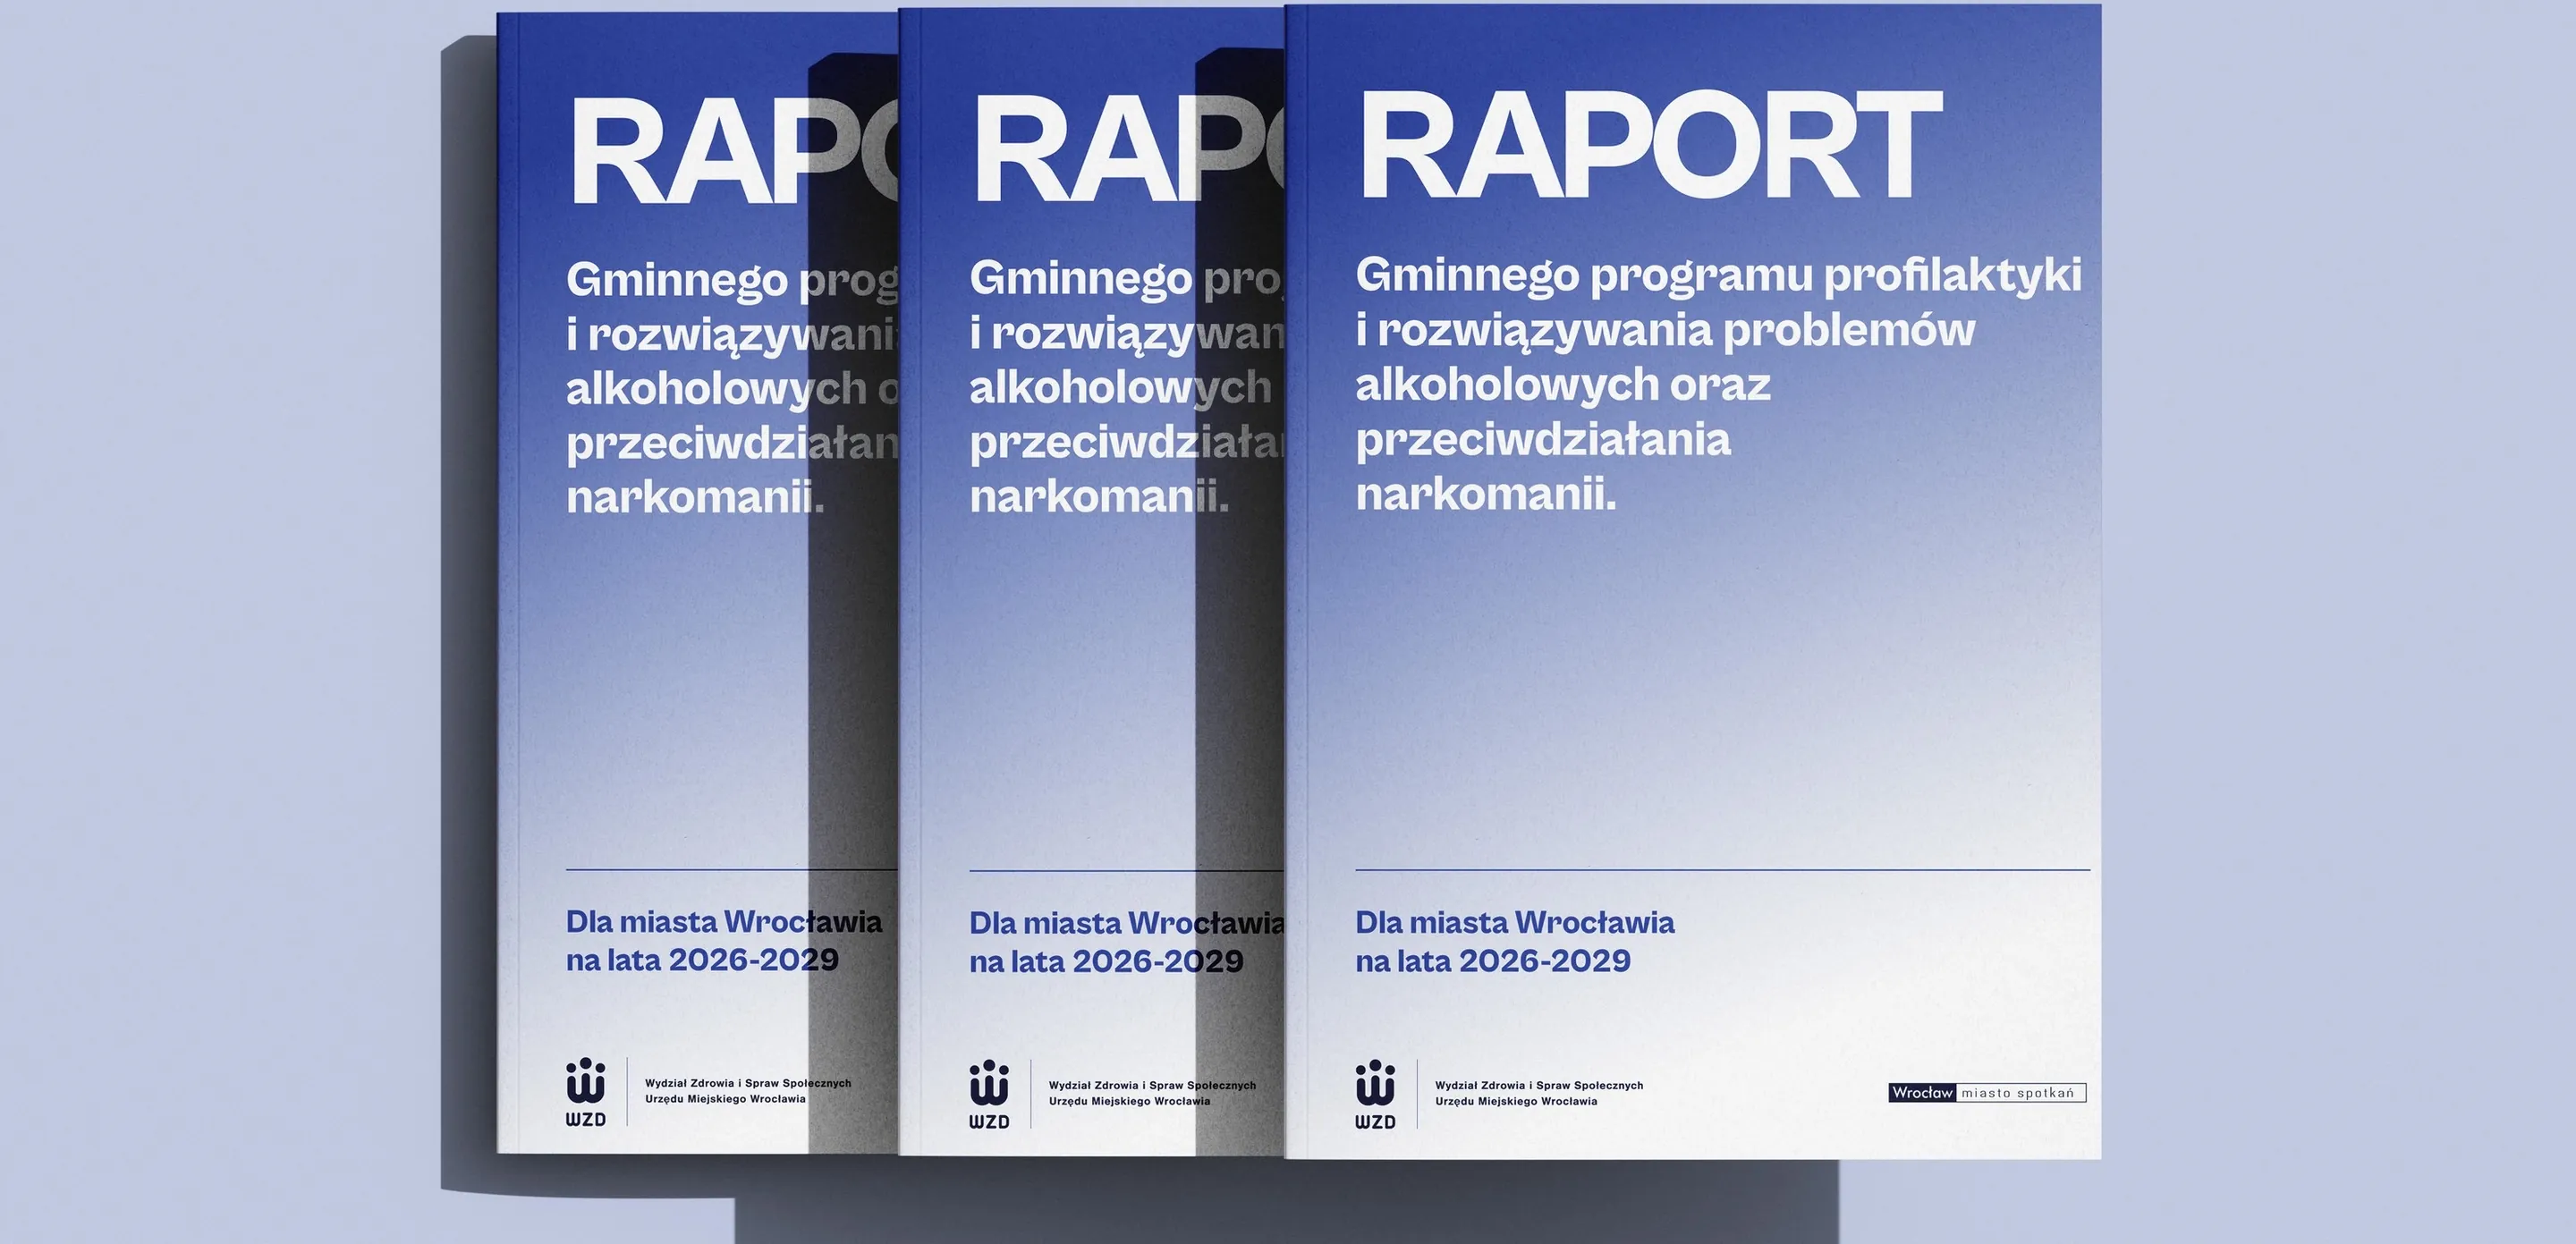
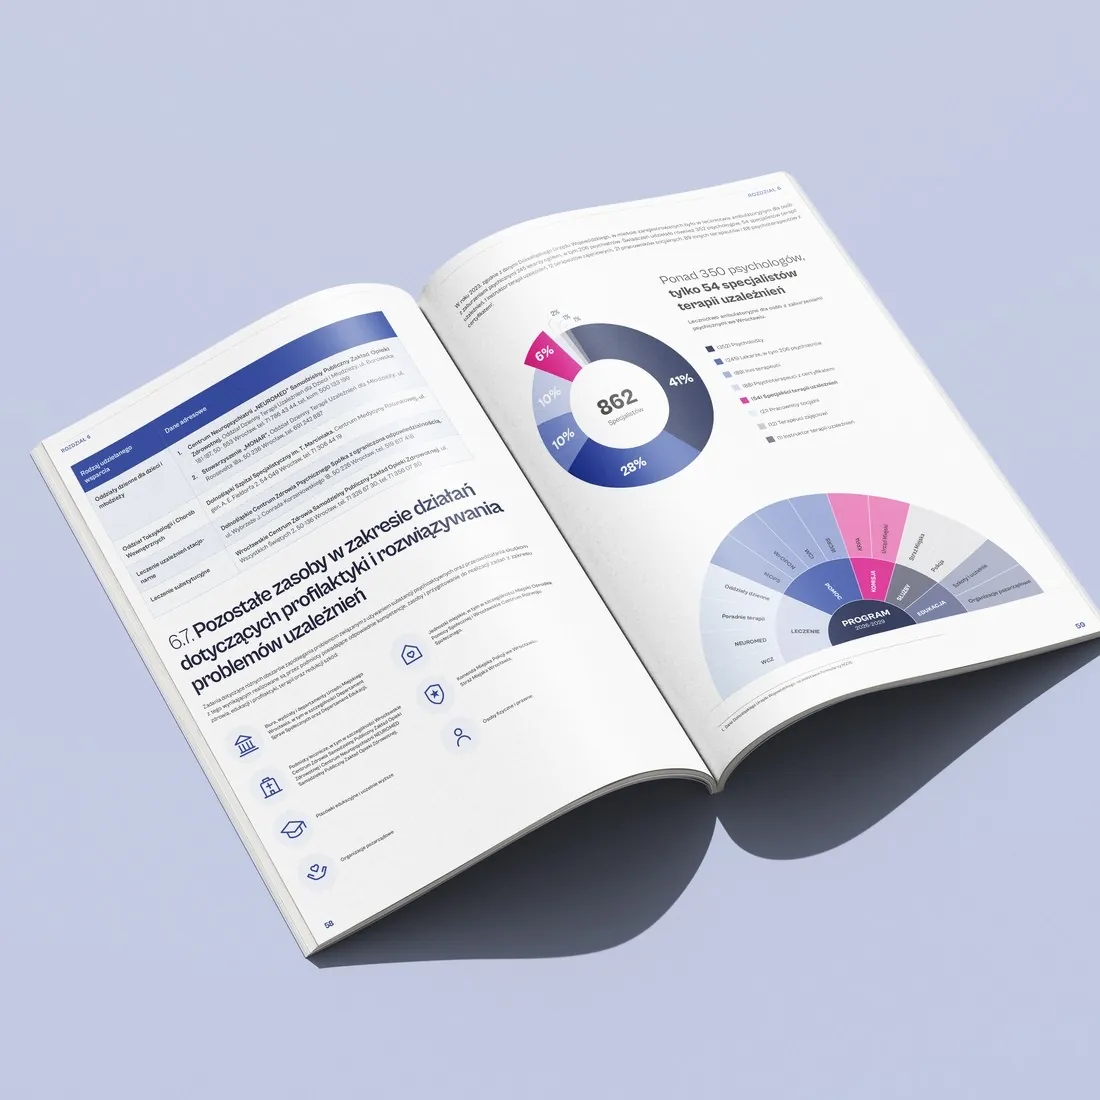
The Report on the Municipal Programme for the Prevention and Solving of Alcohol Problems and Counteracting Drug Addiction is the document in which Wrocław sums up the programme and sets out its direction for 2026–2029. For the Health and Social Affairs Department I designed and laid out the entire publication – from the cover to the print-ready file. The client mostly supplied raw data: tables, summaries and survey results. From these I created infographics, charts, maps and illustrations that make the key figures visible at a glance, so the report reads like a magazine rather than an official document.

Client

Health and Social Affairs Department, Wrocław City Hall

Year

2026

Scope of work

  • cover and report layout design
  • infographics, charts and maps built from raw data
  • chapter-opening illustrations
  • typesetting of texts and tables
  • print-ready file preparation

Service: print design
Process

From challenge to finished project.
Challenge

The source material consisted of dozens of tables and summaries: the number of consultations given, programme participants, alcohol outlets, survey results among students and adults, and data from successive years. In that form the report would be reliable but hard to take in – for councillors and officials as well as for residents, organisations and the media. The challenge was to keep the full, verifiable content while drawing out what matters most, without oversimplifying difficult subjects such as addiction or psychological violence.

Goal

To design a clear print publication in which the key conclusions are visible at first glance: with a strong chapter hierarchy, readable tables and infographics that show the scale of the city's activities and changes over time. The report had to look modern and consistent with Wrocław's visual identity while remaining an official document.

Solution

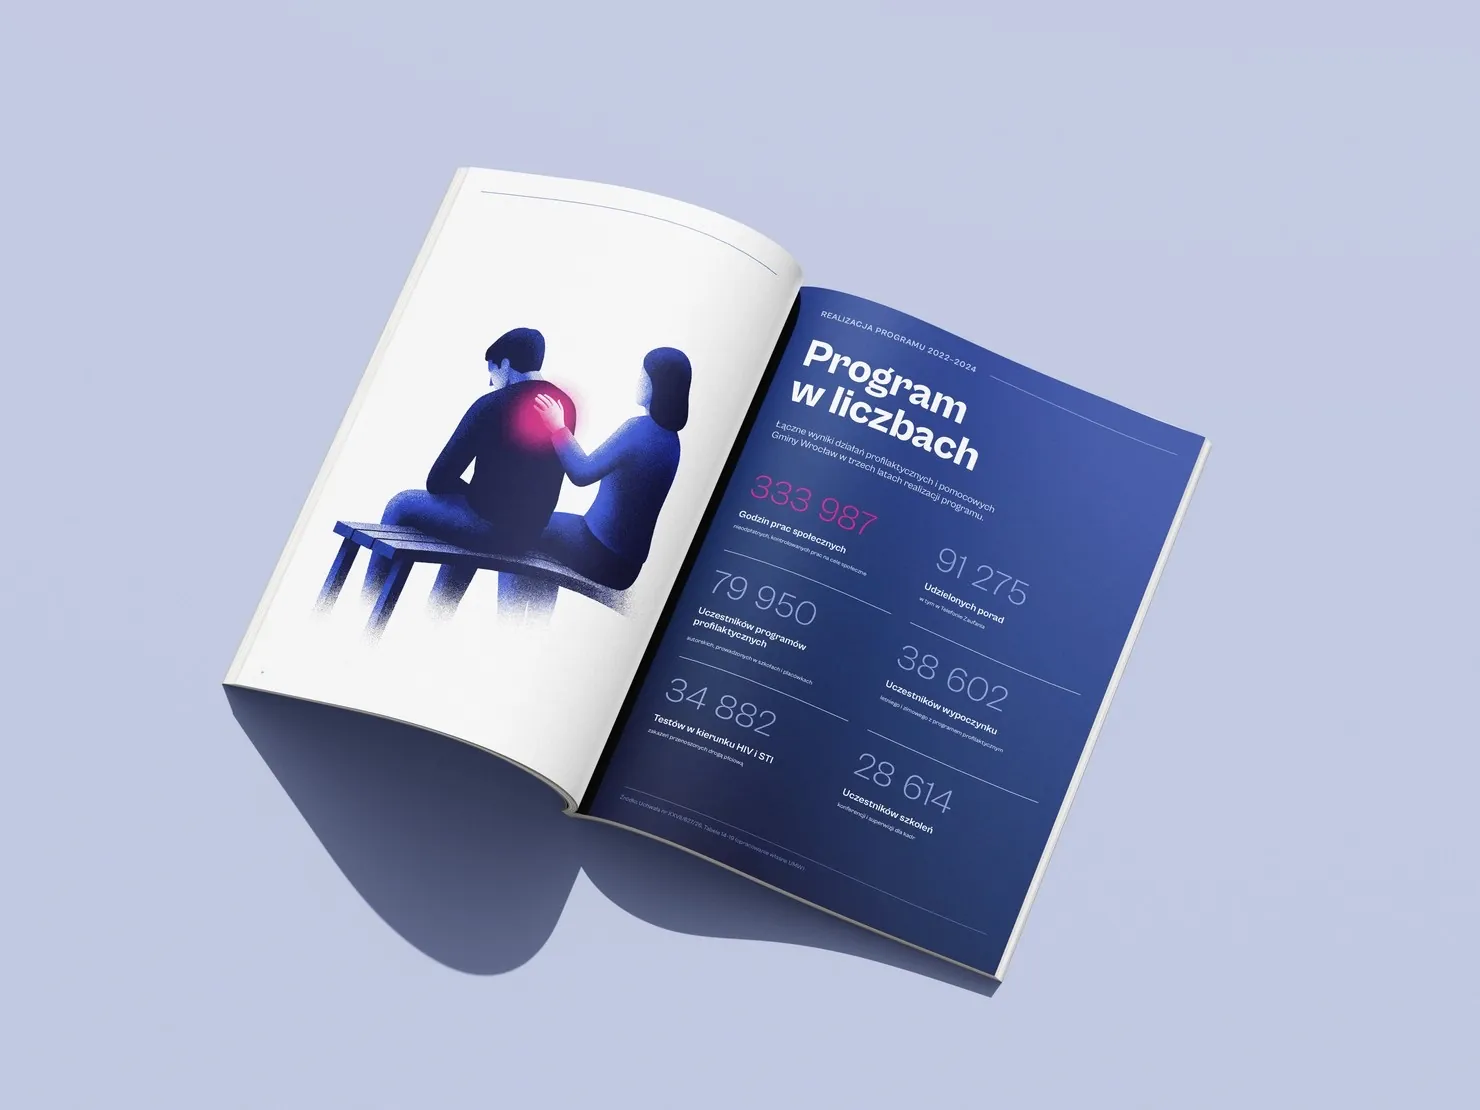
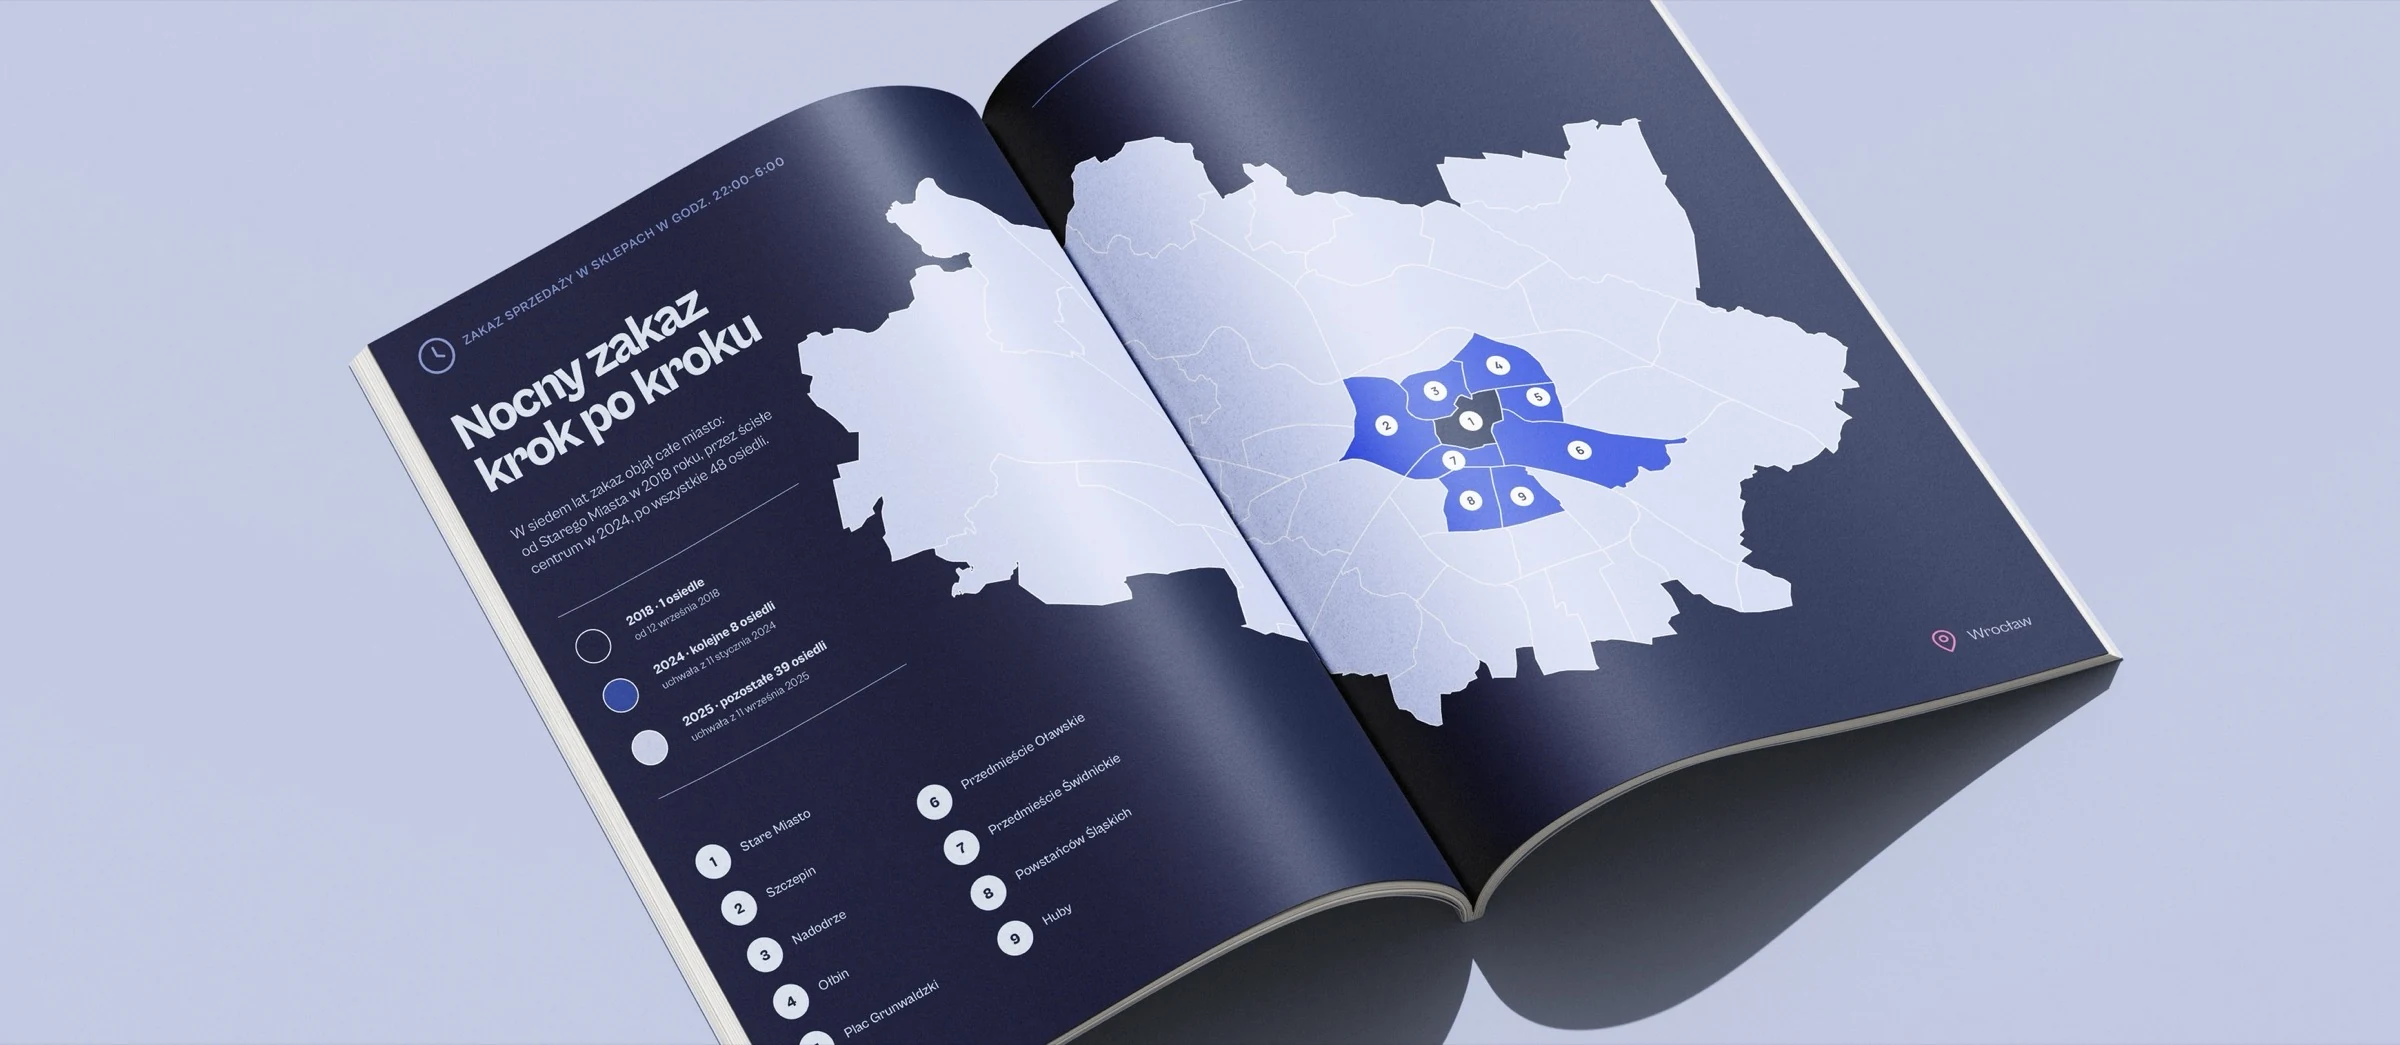
I based the report on deep navy and blue with a pink accent that highlights the most important figures. Each chapter opens with a dark spread featuring an illustration or a large infographic – such as “The programme in numbers”, showing the results of three years of work, or a map of Wrocław explaining the night-time alcohol sales ban step by step. I turned the raw data into pie and bar charts, percentage indicators, distribution maps and icon arrays, and set the full tables in a clear, consistent style. I took care of the layout grid, typography and page rhythm so that a long document is easy to browse. Finally, I prepared the print-ready file.

You're one step away from a great decision.  Book a call or give me a ring.

Call me
+48 606 794 816